
Customer Reporting Dashboards: build the reports you need
Customer Reporting Dashboards let you build your own live dashboards from your sales, payments, labor, tab, and product data, then share them with your team and locations. This article covers where to find the tool, how it is organized, what you can report on, and how to get your first dashboard in place.
Customer Reporting Dashboards let you build the reports that matter to you, instead of working only from the standard report pages. You choose the numbers, how to break them down, and how they look. Then you group them on a dashboard that stays current for whatever dates and locations you pick.
Each dashboard is made of widgets. A widget is one chart, table, or headline number. Dashboards can be shared with people at your locations, and a single dashboard can report across every location you have access to.
Where to find it
Section titled “Where to find it”- Open the Manager Dashboard.
- In the left navigation, scroll to the Report section and select Custom Reporting. It sits at the bottom of that section. Select the star to add it to your favorites at the top of the navigation.
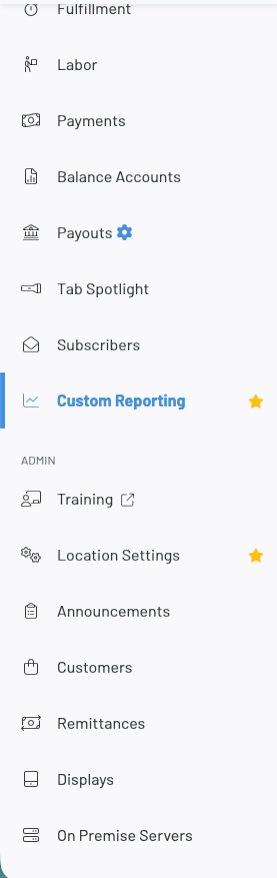
The tool opens inside the Manager Dashboard frame. You can also go straight to dashboards.gotab.io and sign in with your GoTab account.
The first time you open it, you may be asked to choose your locations before any reports appear. See Manage and share your dashboards for how that works.
Custom Reporting appears for users who have the Manage: Analytics permission. Your account sets this permission user by user, so an administrator at your business decides who has it. If you don’t see Custom Reporting in your navigation, ask your administrator to check your permissions, or contact GoTab Support.
How the screen is organized
Section titled “How the screen is organized”The tool has its own sidebar next to the dashboard you are viewing. Select the collapse icon at the top of the sidebar to give the dashboard more room.
| Area | What it holds |
|---|---|
| Marketplace | A library of ready-made dashboards you can preview and install. See Dashboard Marketplace. |
| Mine | Dashboards you created or installed. Use the + to create a new dashboard and the folder icon to organize them. |
| Shared with me | Dashboards other people shared with you. A new tag shows when something has not been opened yet. |
| Account menu (bottom left) | Change locations, switch between System, Light, and Dark appearance, and sign out. |
Key terms
Section titled “Key terms”| Term | What it means |
|---|---|
| Dashboard | A named collection of widgets built around one question or theme, such as “Accounting overview” or “Membership activity”. There is no minimum or maximum number of widgets. |
| Widget | One chart, table, or headline number on a dashboard. |
| Metric | A number you can measure, such as net sales, quantity, tips, or labor hours. |
| Grouping | How a metric is split up, such as by business day, hour, menu category, server, or location. |
| Certified | A standard, reviewed definition of a metric. See Check your numbers. |
What you can report on
Section titled “What you can report on”Every widget is built from a metric and one or more groupings.
| Data | Examples of what you can measure |
|---|---|
| Sales | Net sales, gross sales, quantity, tax, tips, service fees and autogratuity, comps and refunds |
| Ledger | Debit, credit, and net, from the same ledger that sales reports are built on |
| Item options | How many times each modifier or option was ordered |
| Sales by payment | Amounts, tax, and tips split by the payment that paid for them |
| Labor | Hours, labor cost, declared tips, and shifts |
| Tabs | Tab counts, covers, subtotals, and tab-level tax and autogratuity |
| Locations | Number of locations |
You can split those measures by things like business day, hour of day, location, city, state or province, server, product, menu category, product type, zone, spot, account, payment type, labor role, tab, and customer. Not every metric works with every grouping. The builder shows you what is available and explains why anything is not. See Build a widget.
Four ways to get started
Section titled “Four ways to get started”- Install a ready-made dashboard. Browse the Marketplace, preview a dashboard with your own data, and install it. This is the fastest way to see what is possible. See Dashboard Marketplace.
- Build your own. Create a dashboard, add a widget, and choose your metrics and groupings. See Build a widget.
- Build with your AI assistant. If you use an AI assistant such as Claude or ChatGPT, you can connect it to your dashboards and ask for what you need in plain language. See Build with your AI assistant.
- Ask your account manager. Your GoTab account manager can build custom reports for you. If you have a report you are used to from another point of sale, or one you found online, share it with your account manager and they can help recreate it as a dashboard. If GoTab has built custom reports for you before, your account manager will recreate them as dashboards and share them with you.
How this fits with other reporting tools
Section titled “How this fits with other reporting tools”| Tool | Best for |
|---|---|
| Manager Dashboard reports (Sales, Product Mix, and others) | Standard reports with fixed layouts. |
| Customer Reporting Dashboards | Reports you design yourself, saved on dashboards that you can share, organize, and reuse. |
| GoTab Data Hub | Asking a one-off question and getting a table or chart back. See Getting the most out of Lovey and GoTab Data Hub. |
| Lovey | Quick answers in the support chat. Lovey does not build dashboards. When it builds a chart for you, it opens it in Data Hub. |
What to keep in mind
Section titled “What to keep in mind”- Dashboards are read-only views of your data. They show you numbers. They do not change anything in your account.
- You only see locations you have access to. If you share a dashboard, each person sees data for their own locations, so two people can see different totals on the same dashboard.
- Some measures have limits. For example, labor cost uses straight-time wages only. See Check your numbers before you rely on a figure for a financial decision.
- This tool is growing. We are adding metrics, groupings, and builder options over time, and screens may change as we respond to your feedback.
Tell us what is missing
Section titled “Tell us what is missing”Contact GoTab Support through the support chat. Ask specifically for the metric to be added to Customer Reporting Dashboards, not the Data Hub dashboard. Describe the report you are trying to build, because that helps us choose the right metric to add. Requests from operators shape what is added next.