
Manage and share your dashboards
Choose which locations and dates your dashboards report on, organize them in folders, and share them with people or whole locations. This article also covers dashboards shared with you, duplicating, exporting results, and the appearance settings.
Once you have dashboards, you can organize them, point them at the right locations and dates, and share them with your team. Everything in this article is done from Custom Reporting in the Manager Dashboard, or at dashboards.gotab.io.
Choose your locations
Section titled “Choose your locations”Dashboards only show data for the locations you select, and only locations your account already has access to. You can select up to 50.
- If a Choose locations message appears the first time you open the tool, search for a location by name or ID and select it. Selected locations appear as tags with a count such as “1/50 selected”.
- Select Continue.
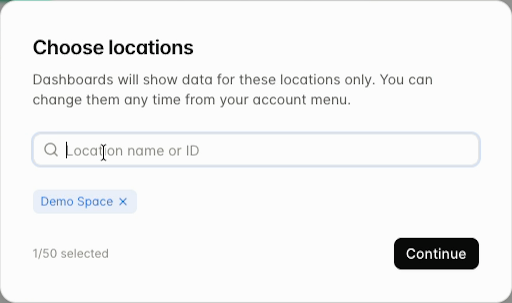
To change your locations later, open the account menu at the bottom left of the sidebar and select Change locations.
When you select more than one location, your dashboards report on all of them together, and a locations control appears at the top of each dashboard, such as All locations (2). Use it to choose which of your locations a dashboard is looking at. The data follows your choice.
If the location selection does not stay, check the count after you select Continue, refresh the page once, and open Change locations again. If it returns to zero, or a location you expect is missing, ask your administrator or GoTab Support to confirm your access.
Choose your dates
Section titled “Choose your dates”Use the date control at the top of a dashboard. It shows both the name of the range and the actual dates.
| Choose | Covers |
|---|---|
| Today | The current business day so far. It may be incomplete. |
| Yesterday | The previous business day |
| Last 7 days | The seven days before today |
| Last week | The previous full week, Monday to Sunday |
| Last 30 days | The thirty days before today |
| Last 90 days | The ninety days before today |
| Month to date | From the first of this month |
| Last month | The previous full calendar month |
| Custom range… | Any dates you enter. Both the start and end date are included. |
The same dates apply to every widget on the dashboard and to every location the dashboard is looking at.
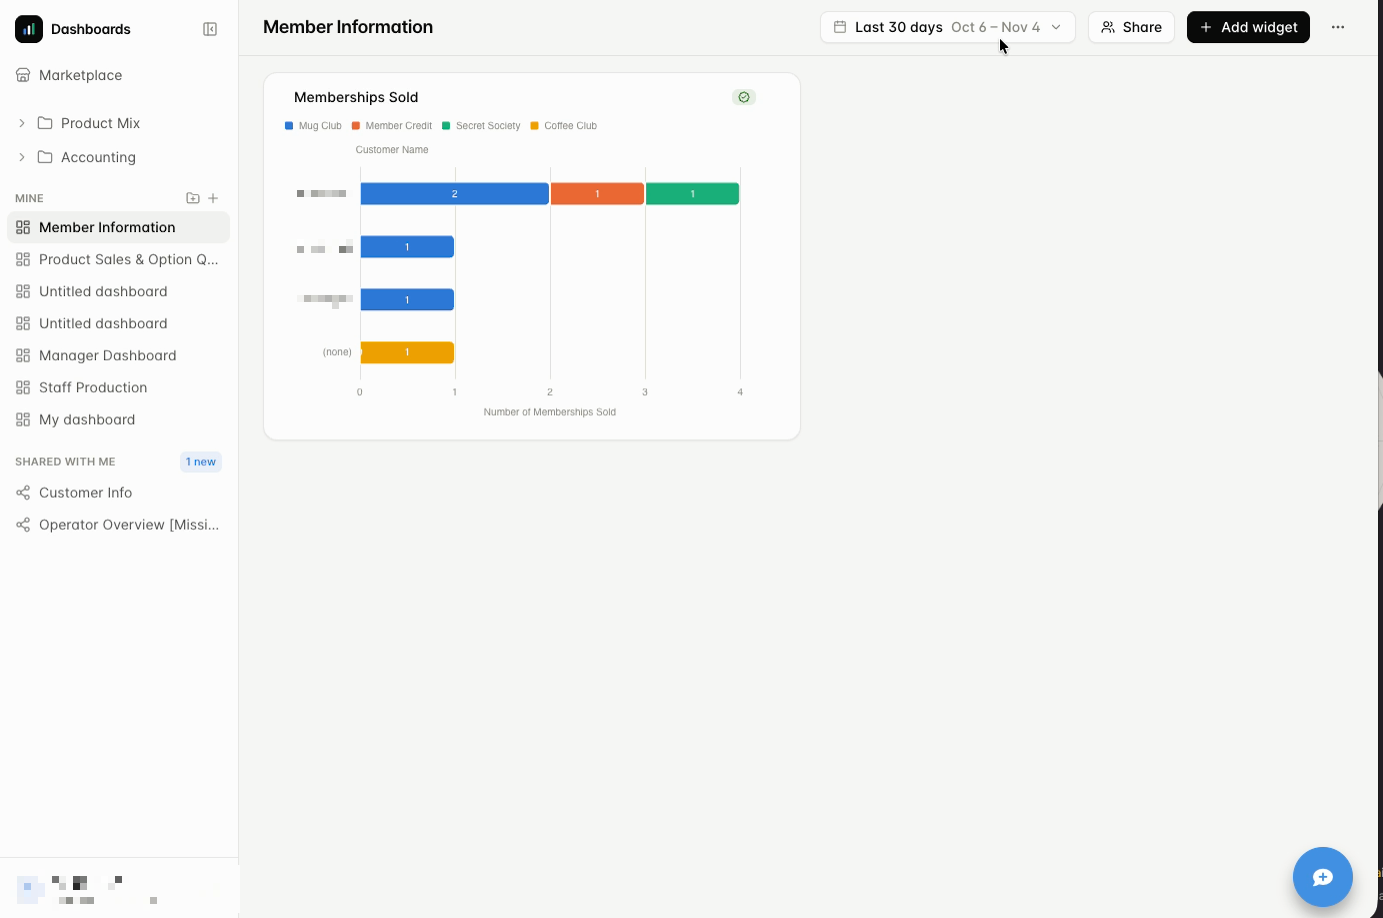
Reports that use Business day follow each location’s operating-day cutover, so activity after midnight can belong to the previous day. Choose complete weeks for week-to-week comparisons, and choose Last month or a complete custom month for monthly close.
Organize your dashboards
Section titled “Organize your dashboards”Your own dashboards are listed under Mine.
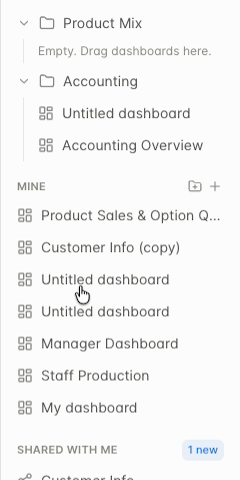
- Create a folder: Select the folder icon next to the + in the Mine header and name the folder, such as “Product mix” or “Accounting”.
- Move a dashboard into a folder: Drag it into the folder. Select the arrow on a folder to collapse or expand it. An empty folder says “Drag dashboards here”.
- Rename a dashboard: Select its title at the top of the dashboard and enter the new name.
- Delete a dashboard: Select the three dots at the top right of the dashboard and choose Delete dashboard. Review any confirmation before you continue, and do not assume a deleted dashboard can be recovered.
Work on a copy
Section titled “Work on a copy”To change a widget but keep the original, open the widget’s three-dot menu and choose Duplicate, then edit the copy. This also applies to dashboards you install from the Marketplace: do not assume an installed dashboard is read-only, and do not assume your changes are undoable.
Share a dashboard
Section titled “Share a dashboard”Share a dashboard you own to give your team a live view.
- Open the dashboard and select Share at the top.
- Under Locations, check a location to share with everyone who has access to that location.
- Under People, choose a location from the list, then check the people you want, or search by name. Everyone you pick appears as a tag at the bottom, with a count such as “Shared with 3”.
- Select Save. Select Cancel to leave without changing who has access.
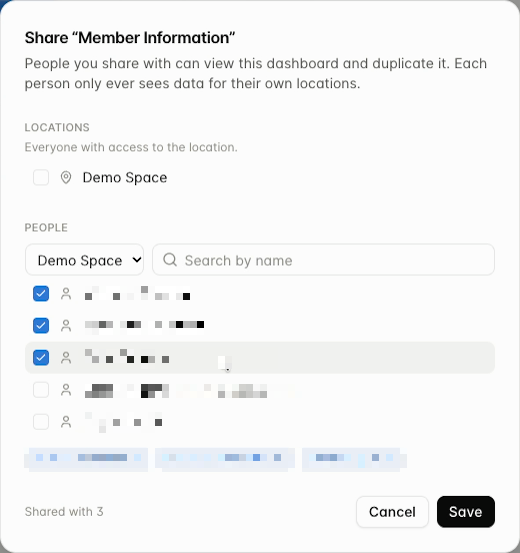
What people you share with can do: they can view the dashboard and duplicate it. They cannot change yours.
What people you share with see: each person only ever sees data for their own locations. If you share a dashboard with two people who have access to different locations, they will see different totals on the same dashboard. This is expected, and it is also why a teammate’s numbers may not match yours. Compare your location selections first.
Who you can share with: you can share a dashboard with people at the locations you have access to. If you have access to more than one location, you can build a dashboard that reports on several of them, then share it with people at any of those locations. The Share window only lists those locations and their people.
Sharing beyond your locations: to reach people outside your locations, such as someone at a separate GoTab location, contact your account manager and ask them to publish your dashboard to the Marketplace. Only GoTab staff can publish there. Everyone who installs it still sees data for their own locations only.
Dashboards shared with you
Section titled “Dashboards shared with you”Dashboards other people share with you appear under Shared with me in the sidebar. A new tag shows until you have opened one.

- A shared dashboard opens view only. The header says who shared it and that it shows your locations.
- Select Remove from sidebar if you do not want to keep it in your list.
- Select Duplicate to my dashboards to keep a copy. Your copy is not linked to the original. You can rename it, edit its widgets, and drag it into a folder, and nothing you change affects the person who shared it.
Download results
Section titled “Download results”Each widget can be downloaded on its own. Open the widget’s three-dot menu and choose Download Excel (.xlsx) or Download CSV. Downloads are per widget, so download each table or chart you need.
Keep the date range and the locations with the file you download so someone else can reproduce your numbers.
Schedule a report by email
Section titled “Schedule a report by email”Every dashboard has a Schedule email option in the dashboard menu. If you don’t see it, contact GoTab Support. You can also use the widget downloads above.
To schedule a report:
- Open the dashboard menu and choose Schedule email. Choose Whole dashboard or Chosen widgets.
- Choose a format: PDF, PDF and Excel, Excel, or CSV. Excel uses one sheet per widget and leaves out single-number widgets.
- Choose Daily, Weekly, or Monthly, a send time, and a time zone.
- Set the schedule’s own date range, locations, and recipients. These are separate from the dates currently shown on the dashboard. A schedule supports up to 50 locations and 50 recipients.
- Select Schedule.
| Recipe | Frequency | Date range | Format |
|---|---|---|---|
| Morning recap | Daily | Yesterday | |
| Weekly review | Weekly | Last week | PDF and Excel |
| Monthly close | Monthly | Last month | Excel |
Things to know about scheduled emails:
- The date range is worked out fresh each time it sends, from each location’s business day.
- The report runs as the person who created the dashboard and reflects the dashboard as it is when it sends, so later edits can change future emails.
- Recipients are blind-copied, and the attachment contains the data as a file. Choose recipients who are allowed to see every selected location’s results.
- For a monthly close, pick a send time that lets the previous business day finish and reports update.
Appearance and account menu
Section titled “Appearance and account menu”The account menu at the bottom left of the sidebar has these options:
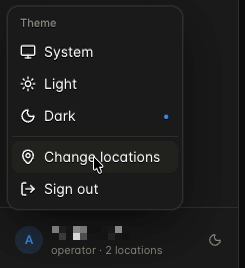
- Theme: Choose System (matches your computer), Light, or Dark. The theme only changes the dashboard area. It does not change the rest of the Manager Dashboard, which is currently light only.
- Change locations: Choose which locations you report on.
- Sign out: Ends your session.
Select the collapse icon at the top of the sidebar to give your dashboard more room. You can still reach the rest of the Manager Dashboard from its own navigation.