
Getting the most out of Lovey and GoTab Data Hub
A practical guide to asking better questions, building your own reports, and finding insights in your GoTab data — whether you use Lovey, Data Hub, or both together.
Think of Lovey and GoTab Data Hub as two doors into the same room.
Lovey is the conversational door — it lives in your GoChat support window and answers questions in plain language, whether that’s a setup question or a business question. GoTab Data Hub is the direct door — a self-serve dashboard at datahub.gotab.io where you can build, save, and reuse your own reports without asking anyone anything.
Both only ever show you data for the location(s) you’re authorized to see, and both are strictly read-only: they can tell you what’s happening and point you to where to make a change, but neither one can make a change in your account for you. All actual changes still happen in the Manager Dashboard.
Every query — whether you typed it to Lovey or built it yourself in Data Hub — lands in the same place. Ask Lovey a question, then click through to refine it further in Data Hub. Or start in Data Hub and never touch Lovey at all. Neither path is more “correct.”
Using Lovey in chat
Section titled “Using Lovey in chat”Lovey is the fastest path to an answer — just ask, the way you’d ask a coworker.
-
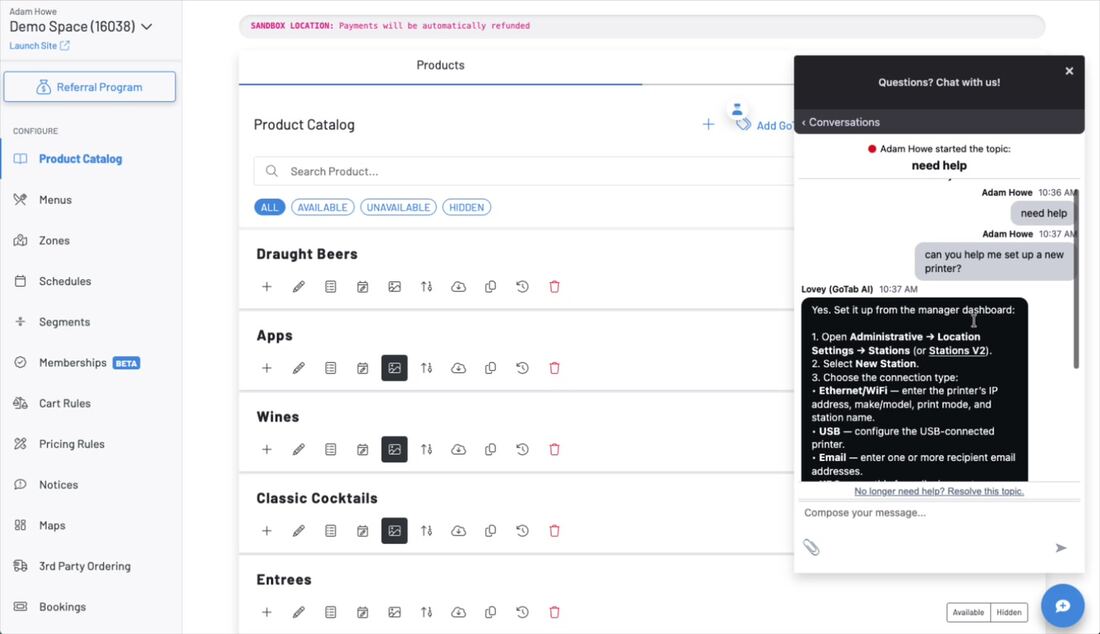
Ask a setup or “how do I” question
Open GoChat from your Manager Dashboard and type your question in plain language. Lovey (labeled “Lovey (GoTab AI)” in the chat) will reply with numbered steps and, when available, the exact navigation path to follow.
-
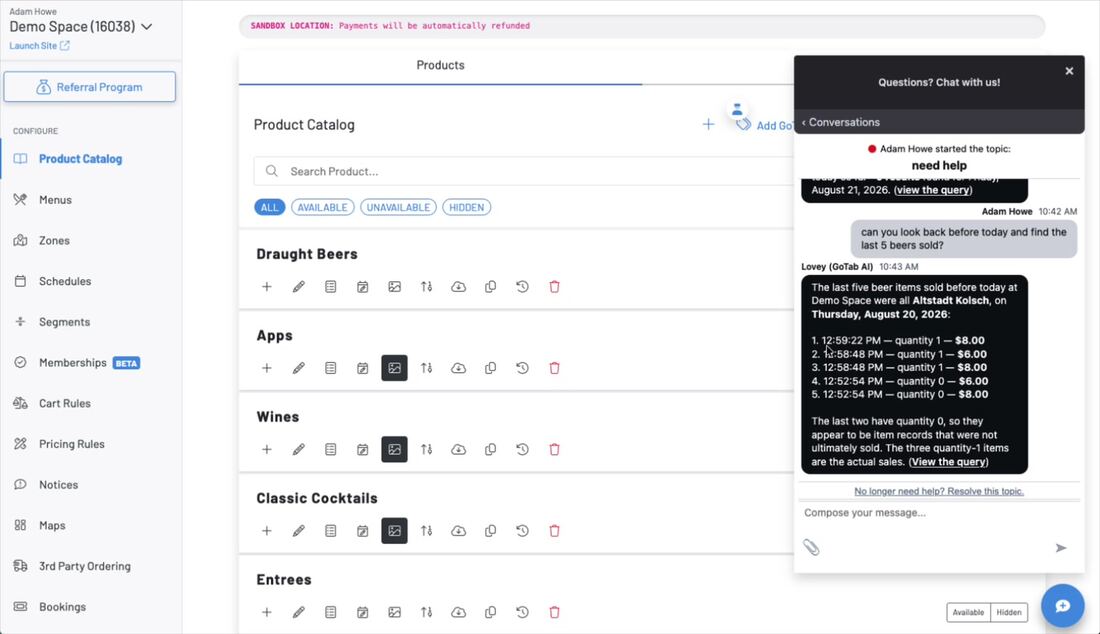
Ask a business question about your own data
Ask something like “show me the last five beers sold” and Lovey will query your location’s data directly and reply with the answer — often down to the exact timestamp and dollar amount. Click View the query to open the same result in Data Hub for the full table or chart.
-
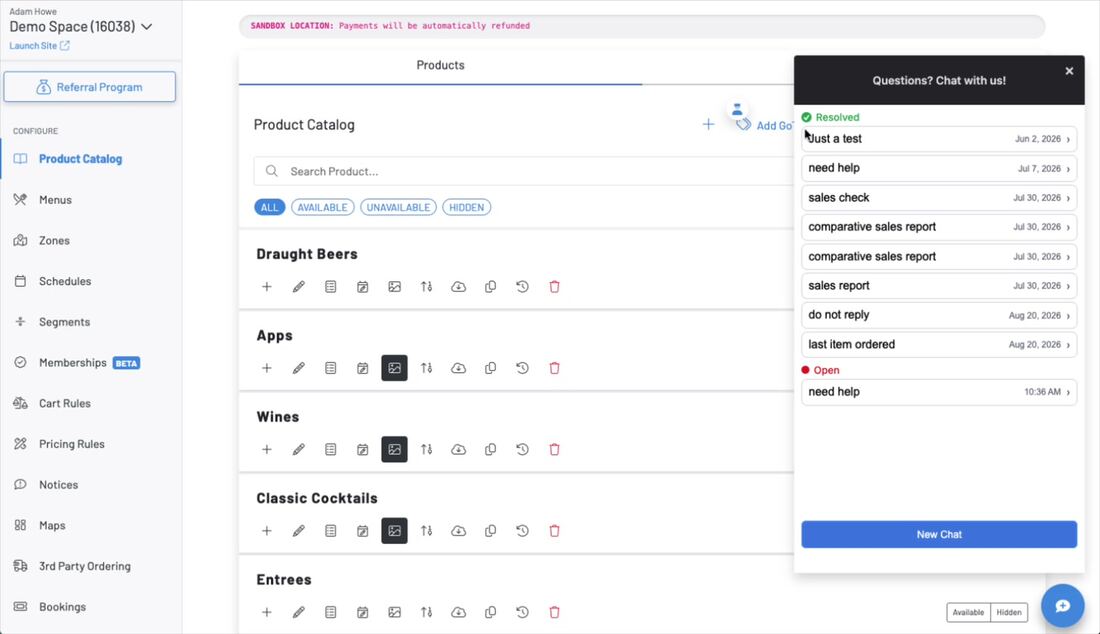
Pick up where you left off
Every conversation with Lovey is saved automatically, whether it’s marked Resolved or still Open. You can come back days later and find exactly what you asked and what it told you — no need to re-ask the same question twice.
Say “I need to speak to a human” at any point and a live GoTab support agent will step into the same conversation. You never have to start over on another channel.
Using GoTab Data Hub directly
Section titled “Using GoTab Data Hub directly”Use Data Hub when you’d rather build the report yourself, or need something Lovey hasn’t answered quite right yet.
-
Go to datahub.gotab.io
Log in using SMS verification, sent to the phone number associated with your GoTab user profile. You’ll only ever see data for the location(s) you have access to — if you manage multiple locations, you can query them together or one at a time.
-
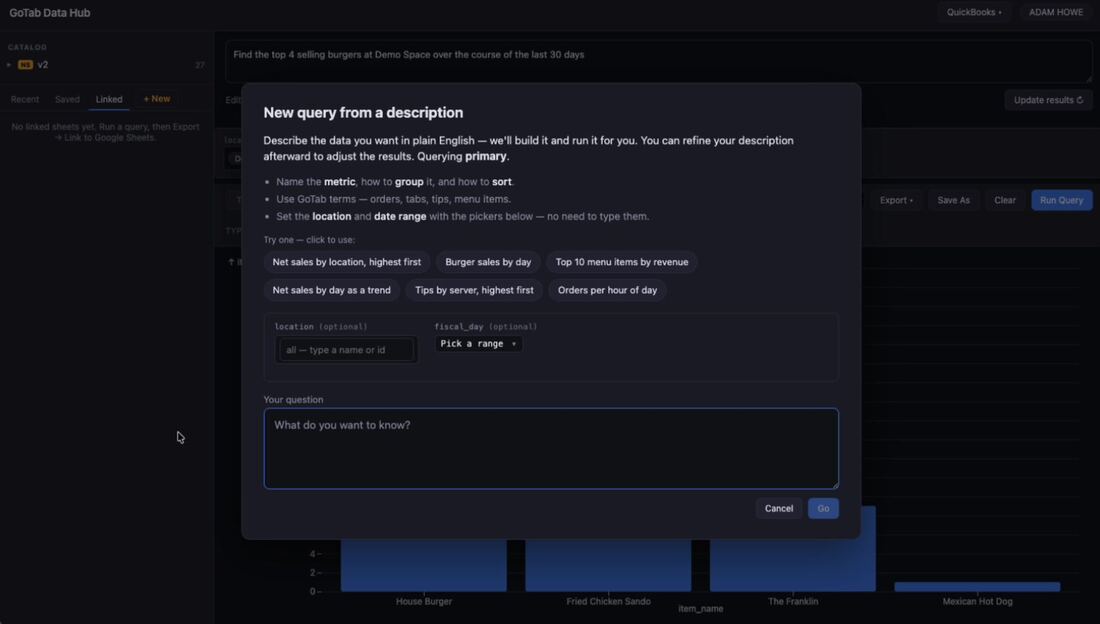
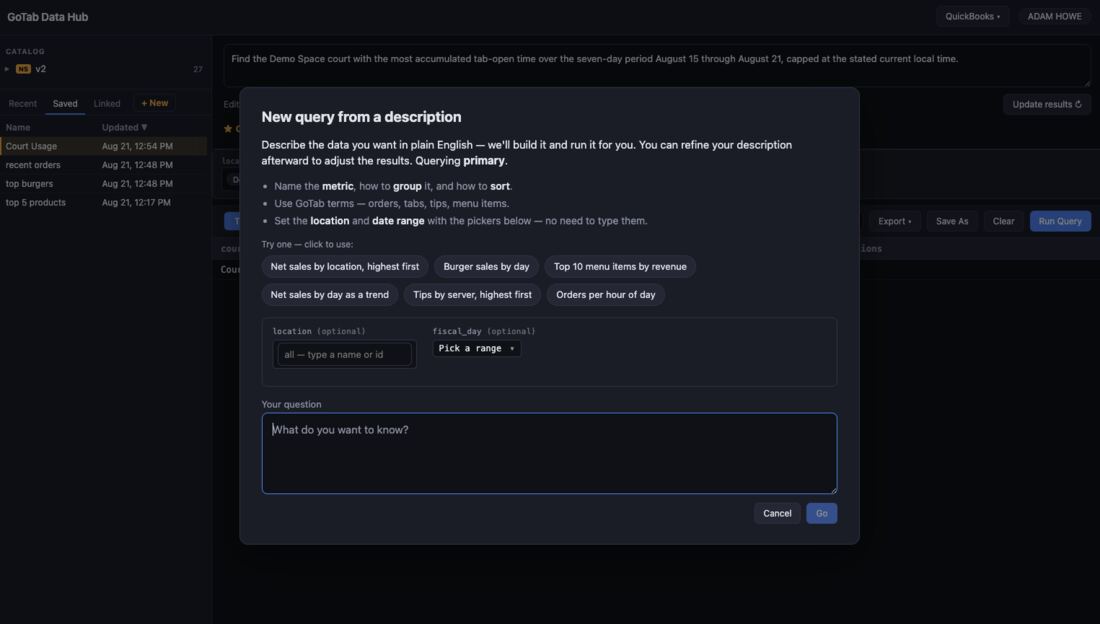
Describe what you want, or start from a template
Click + New and describe your question in plain English in the box at the top — the same way you’d ask Lovey. If you’re not sure where to start, click one of the ready-made templates: Net sales by location, Burger sales by day, Top 10 menu items by revenue, Net sales by day as a trend, Tips by server, or Orders per hour of day. These templates are updated over time based on the questions operators ask most.
-
Set your location(s) and date range
Leave the location field blank to include every location you have access to, or use the tag picker to select specific ones — useful if you manage several concepts and only want to compare a few of them at once. Set your date range with the fiscal-day picker rather than typing dates by hand.
-
Review, refine, and switch views
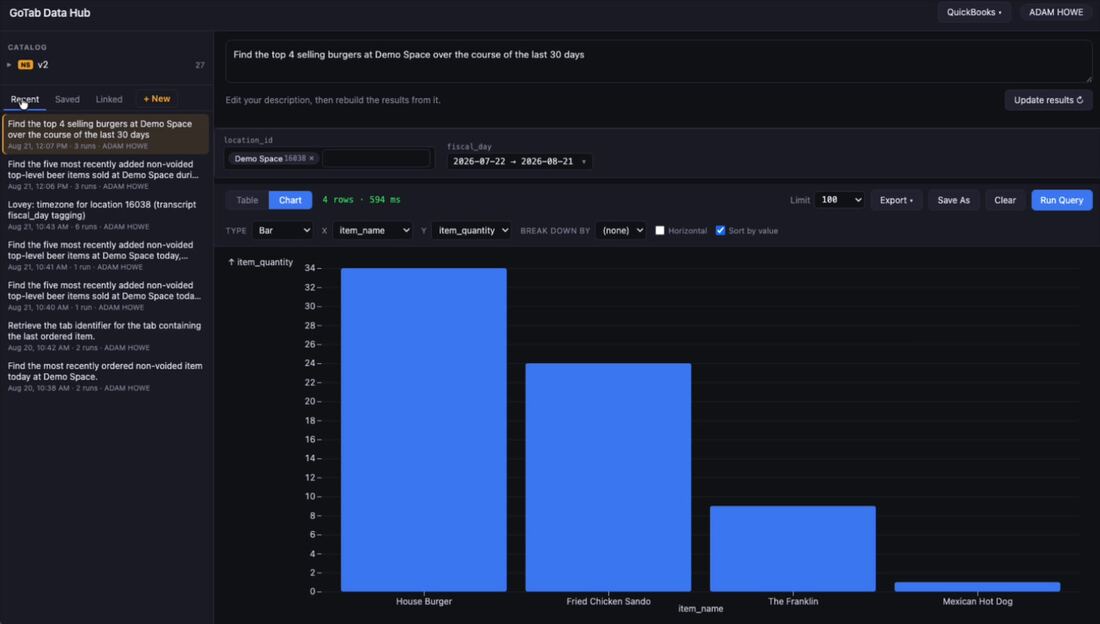
Results appear as a table by default — toggle to Chart for a visual, and use the row count and run time shown above the results (e.g., “77 rows · 549 ms”) to sanity-check what came back. If the answer isn’t quite what you wanted, edit the description at the top and click Update results rather than starting a new query from scratch.
-
Export or share your results
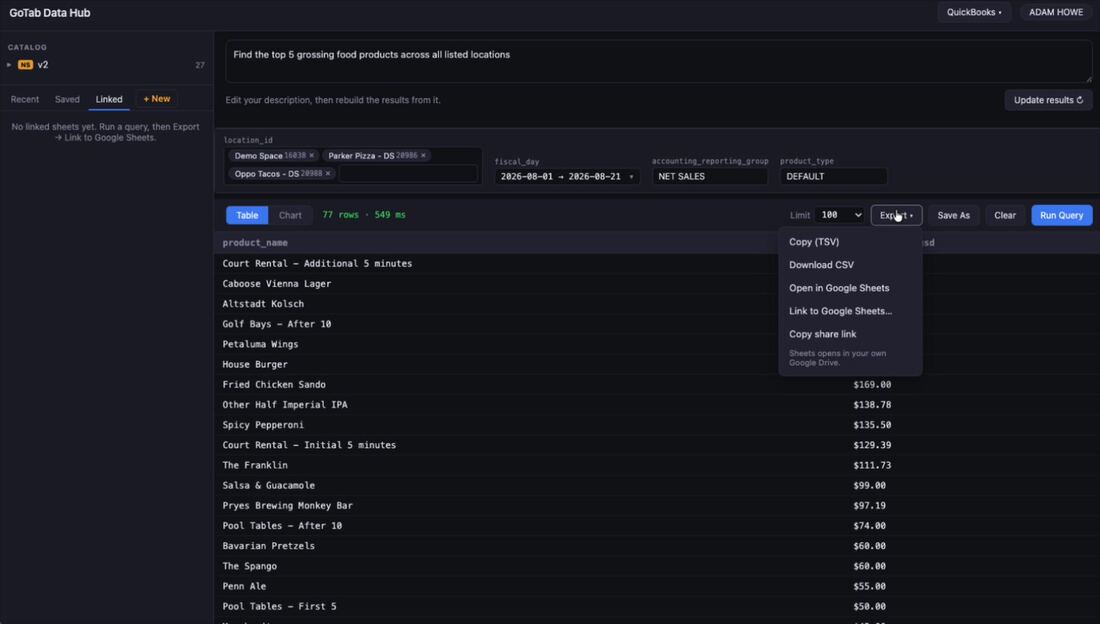
Click Export for several options: copy as TSV, download a CSV, open directly in Google Sheets, link to Google Sheets for a live export that updates when you rerun the query, or copy a shareable link.
-
Save it so you never have to rebuild it
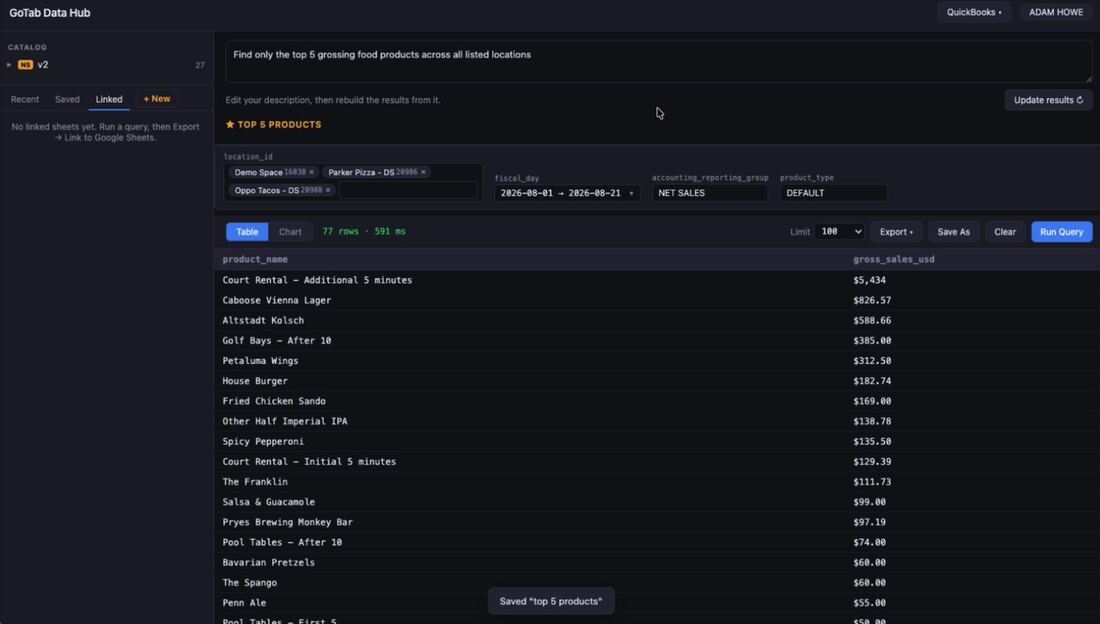
Click Save As and give your query a clear name. It’ll show up under the Saved tab so you (or anyone else with access) can rerun it anytime — just update the date range and go.
-
Find everything later
The Recent, Saved, and Linked tabs on the left keep a running history of every query you’ve run, saved, or connected to a Google Sheet — including ones Lovey ran on your behalf.
Using them together
Section titled “Using them together”The two work best as a pair. Here’s a simple pattern that gets the most out of both:
| Step | What to do |
|---|---|
| 1 | Ask Lovey a quick question in GoChat when you want a fast answer without leaving your conversation |
| 2 | Click “View the query” to jump into the same result inside Data Hub |
| 3 | Refine it — adjust the date range, add a location, switch to a chart — right there in Data Hub |
| 4 | Save it, and it’s ready to reuse next week without asking Lovey (or building it) again |
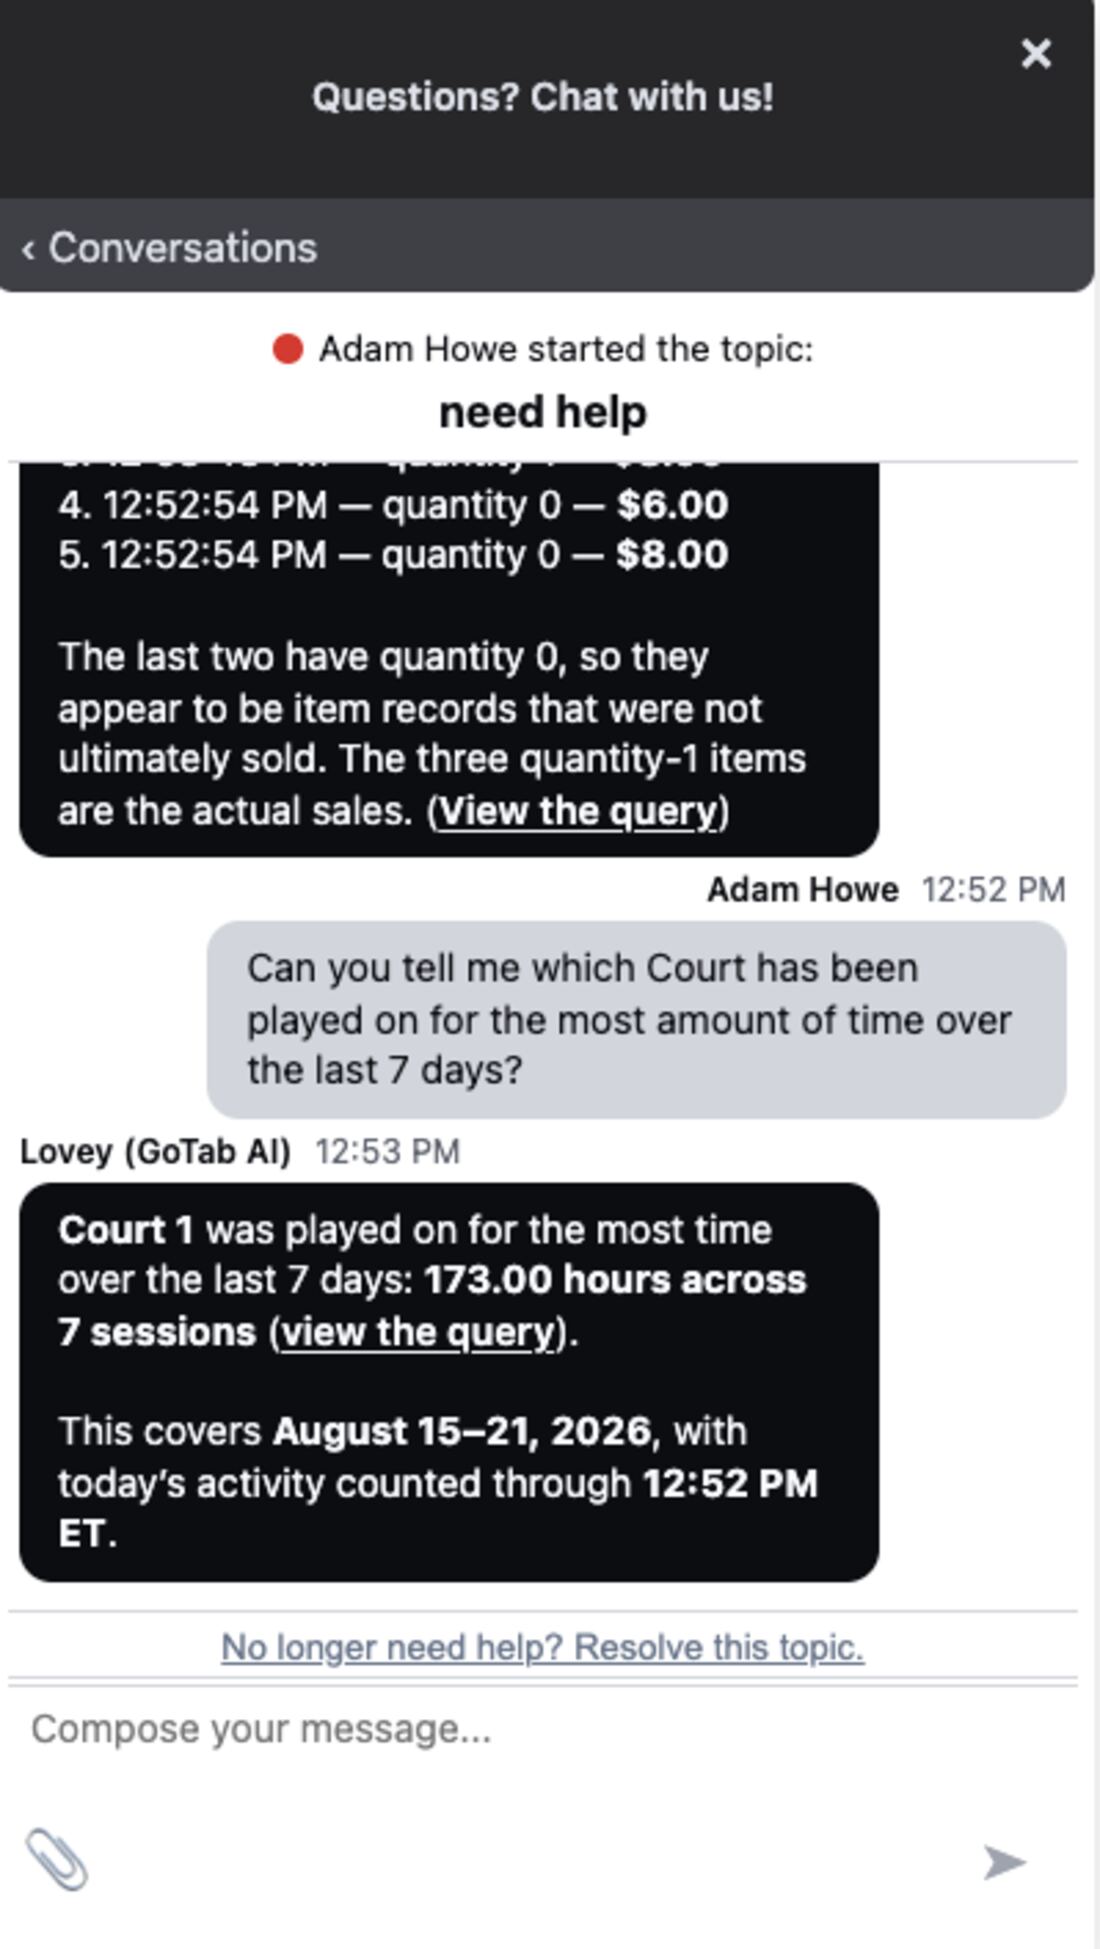
Below is a concrete example of that pattern in action — the same question, answered by Lovey, and the same result opened directly in Data Hub.
Asking Lovey: “which court has been played on the most in the last 7 days?”
The same question, built and run directly in Data Hub:
Suggested use cases
Section titled “Suggested use cases”A few ideas to get you started, organized by the kind of business you run. Try asking Lovey these directly, or build them as saved queries in Data Hub.
Restaurant
Section titled “Restaurant”- Daypart performance check — “How did lunch sales compare to last Tuesday?” Catch a slow shift early instead of noticing it in a monthly report three weeks later.
- Server sales comparison — “Between our three servers today, who sold the most chicken tenders?” A quick, informal way to spot upselling wins worth recognizing at a shift meeting.
Brewery and taproom
Section titled “Brewery and taproom”- Tap performance tracking — “Show me the last five beers sold” or “Top 10 menu items by revenue this month.” Know which taps are earning their handle space before your next keg order.
Food hall
Section titled “Food hall”- Cross-vendor comparison — “Net sales by location, highest first, for this week.” Compare stall-by-stall performance in one query instead of pulling each vendor’s numbers separately.
Eatertainment
Section titled “Eatertainment”- Space and court utilization — “Which court has been played on the most over the last 7 days?” For golf simulators, pickleball courts, batting cages, or pool tables — see which bays are earning their square footage and which are sitting empty.
Multi-location group
Section titled “Multi-location group”- Regional rollups — Select several specific locations in the tag picker, then ask “Net sales by day as a trend.” Build one saved query that a regional manager reruns every Monday instead of stitching together several single-location reports.
Hotel and resort F&B
Section titled “Hotel and resort F&B”- Outlet-by-outlet snapshot — “Compare net sales across all of our outlets for the last 30 days.” See how the pool bar stacks up against the lobby cafe without logging into separate reports for each.
Any concept
Section titled “Any concept”- New team member training aid — “How do I comp a check?” or “How do I mark an item unavailable?” Let a new hire ask Lovey directly instead of pulling a manager away from the floor for basic setup questions.
Best practices and good habits
Section titled “Best practices and good habits”- Be specific about timeframes. “How many beers sold today” is answered literally — if you mean “recently,” say “in the last 7 days” or “before today” instead of relying on Lovey to guess your intent.
- Narrowing a description doesn’t always narrow the results. If you ask for “only the top 5” and still get a longer list back, use the Limit field in Data Hub or refine your wording rather than assuming something’s broken.
- Save anything you’ll ask again. If you notice yourself asking the same kind of question weekly, save it as a named query in Data Hub instead of re-typing it each time.
- Use the tag picker for comparisons. If you run more than one location, select the specific ones you want to compare rather than leaving it blank and sorting through every location afterward.
- Link to Google Sheets for anything you check often. A linked query stays current every time you reopen the sheet, without re-exporting a CSV each time.
- Say “I need to speak to a human” without hesitation. Lovey is meant to be a first stop, not a replacement for support when something needs a person’s judgment.
Keep in mind
Section titled “Keep in mind”Both tools are read-only. Neither Lovey nor Data Hub can change a setting, process a refund, or take any action in your account. They can tell you exactly where to go to make a change — you make it in the Manager Dashboard.
If it’s data your location collects, you can query it. Orders, tabs, tips, menu items, servers, dayparts, court and space usage — if it lives in GoTab for a location you have access to, it’s fair game to ask about. Don’t hold back: put Data Hub through its paces and see what it can tell you about your own business. As a rule of thumb, the more specific your written query — the exact metric, the date range, the location, how you want it grouped or sorted — the sharper and more useful the answer will be.
Both are in beta. You may notice occasional rough edges — an odd result, a link that doesn’t land quite right, or a query that needs rewording. Both tools are actively improving, and every question you ask helps make that happen.