
Build a widget: metrics, groupings, filters, and charts
A widget is one chart, table, or headline number on a dashboard. This article walks through building a widget in the widget builder, explains every control in it, and shows how to read the compatibility messages so you do not build a report that double counts.
A widget answers one question: a total, a trend, a ranking, or a breakdown. You build it in the widget builder by choosing what to measure, how to split it up, and how to show it. Dashboards are collections of widgets, so once you can build one widget you can build any dashboard.
Create a dashboard and add a widget
Section titled “Create a dashboard and add a widget”- In Custom Reporting, select the + next to Mine to create a new dashboard. It starts as “Untitled dashboard”.
- Select the dashboard’s title and enter a name that describes what it is for, such as “Membership activity”.
- Select Add widget at the top right. The widget builder opens.
- Enter a title for the widget at the top of the builder, such as “Customers who purchased memberships”.
You can come back to rename a dashboard or edit any widget at any time.
Choose how to start
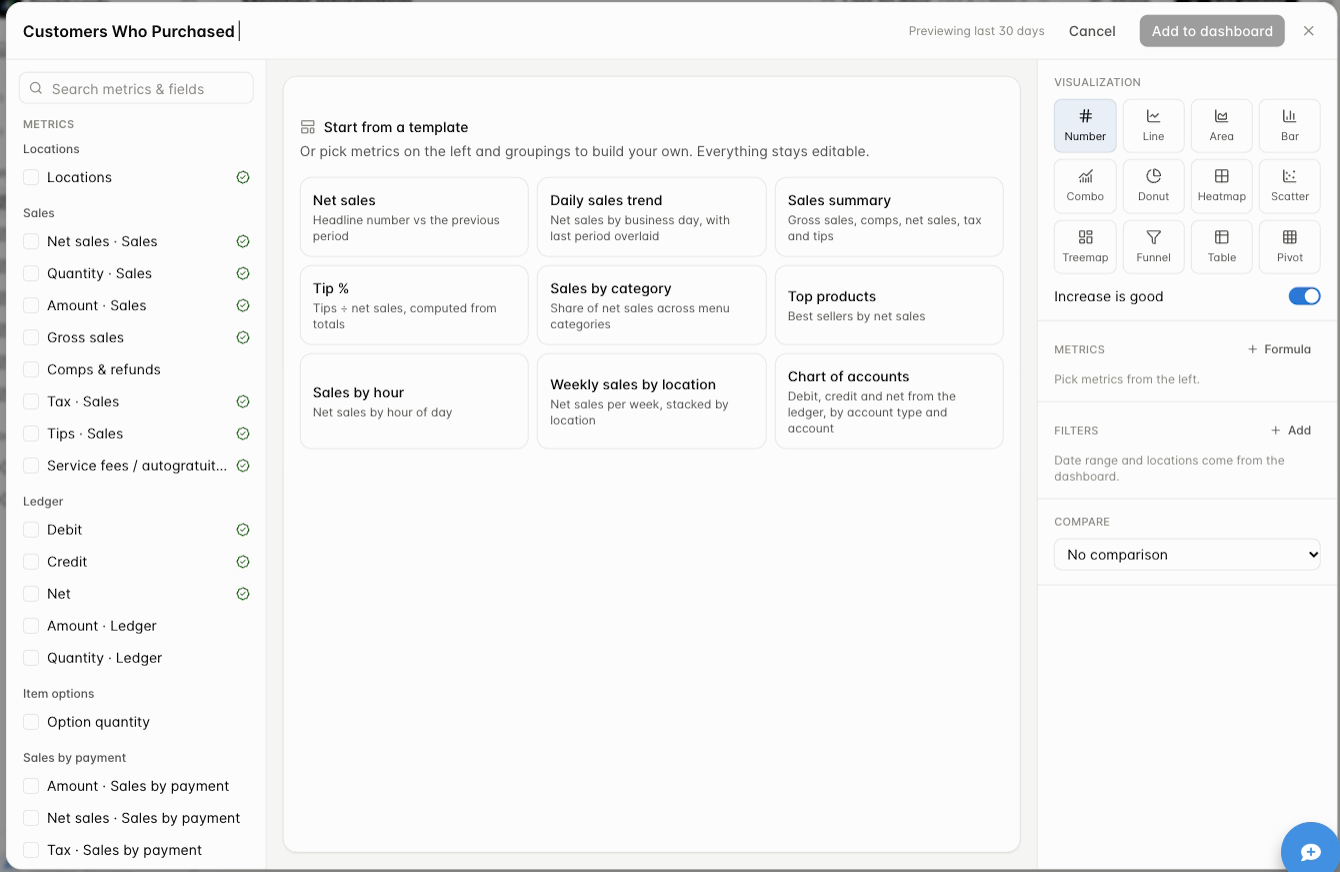
Section titled “Choose how to start”The center of the builder offers Start from a template. A template fills in a complete widget that you can then adjust.
| Template | What it builds |
|---|---|
| Net sales | A headline number compared with the previous period |
| Daily sales trend | Net sales by business day, with the last period overlaid |
| Sales summary | Gross sales, comps, net sales, tax, and tips |
| Tip % | Tips divided by net sales, computed from totals |
| Sales by category | Share of net sales across menu categories |
| Top products | Best sellers by net sales |
| Sales by hour | Net sales by hour of day |
| Weekly sales by location | Net sales per week, stacked by location |
| Chart of accounts | Debit, credit, and net from the ledger, by account type and account |
Or skip the templates and build your own from the metrics list on the left. Everything stays editable either way.
Pick your metrics
Section titled “Pick your metrics”The left side lists every metric you can measure, organized by the kind of data: Locations, Sales, Ledger, Item options, Sales by payment, Labor, and Tabs. Use Search metrics & fields to find one by name.
- Point at a metric to read what it measures before you choose it. Metrics with similar names can measure different things, such as net sales and the amount posted to an account.
- A green check next to a metric means it is certified: a standard, reviewed definition. See Check your numbers.
- Select the checkbox to add a metric. Selected metrics appear in the Metrics section on the right. You can add several metrics to one widget.
Choose your groupings
Section titled “Choose your groupings”Groupings decide how the metric is split up. Scroll the left side to the Group by section.
| Group by | Examples |
|---|---|
| Shared | Business day, Hour of day |
| Locations | Location, City, State or province |
| Servers | Server (every user on the account appears here, not only servers) |
| Products | Product, Menu category, Product type (such as discounts, open items, and delivery fees) |
| Zones | Zone, Zone type, Spot |
| Sales and ledger | Account, Adjustment (comps, voids, refunds), Account type |
| Item options | Option, and the adjustments on options |
| Sales by payment | Payment type or tender, Digital wallet, Paid at (POS, kiosk, customer, or integration), Card present, Payment source, Card last 4 |
| Labor | Role, Clock-in hour, Auto clocked out, Still clocked in |
| Tabs | Tax exempt, Tax exemption ID, Tab, Tab name, Customer ID, Customer, Customer email, Tab status |
Business day can be shown by day, week, month, quarter, year, or day of week.
Order matters. The first grouping you add becomes the main rows or axis. To change the order, remove the top grouping and add it again, and it moves to the bottom of the list.
When a grouping is grayed out
Section titled “When a grouping is grayed out”The builder only lets you combine things that make sense together. When a grouping cannot be used with the metrics you picked, it moves into Not available with your selection and is grayed out. Point at it to read the reason.
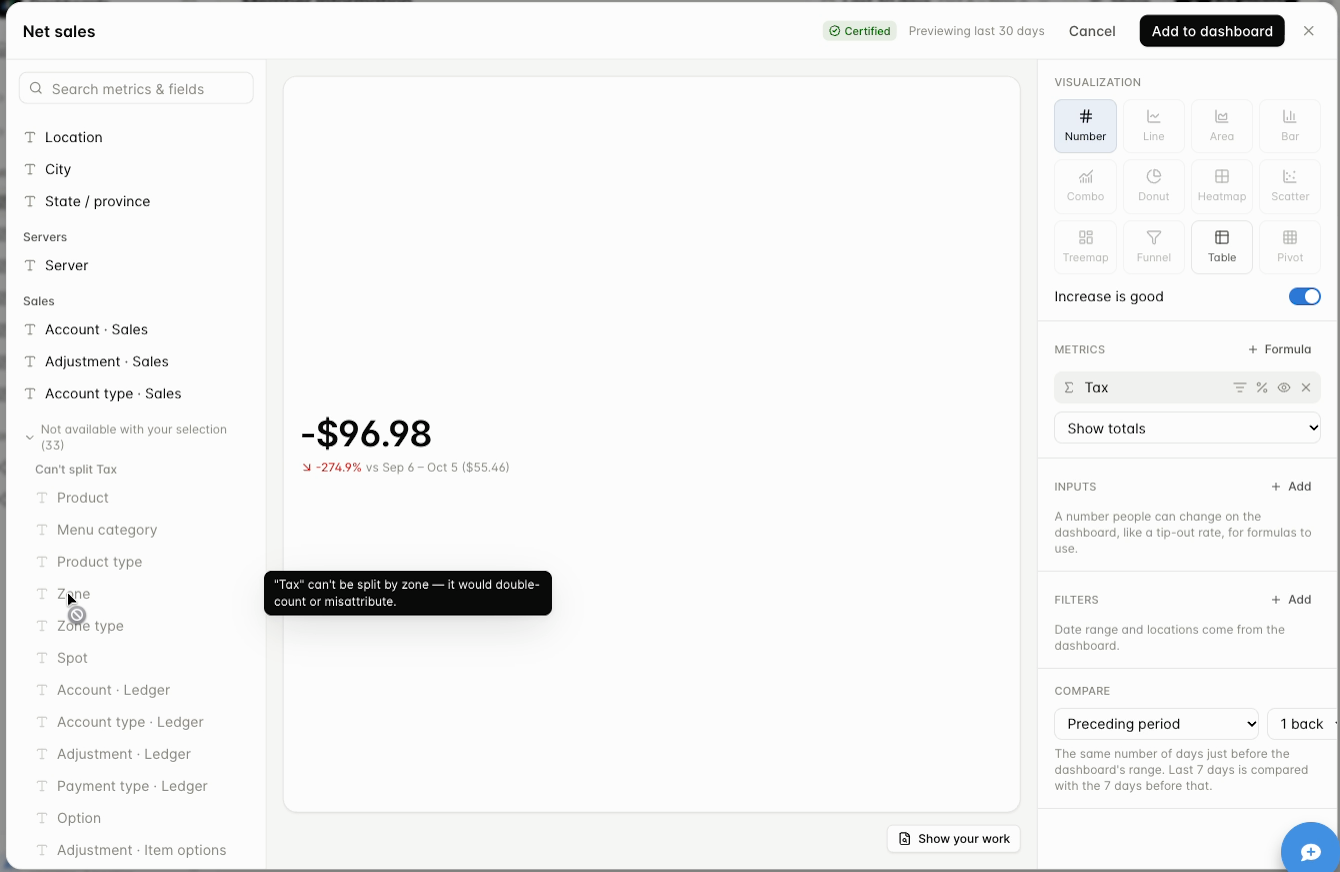
For example, tax cannot be split by zone because it would be counted twice or credited to the wrong place. Because incompatible choices are blocked for you, you cannot accidentally build a broken report. If you need two things that do not work together, build two widgets.
Choose a visualization
Section titled “Choose a visualization”On the right, pick how the result should look. The options you can use depend on how many metrics and groupings you have chosen.
| Visualization | Use it for |
|---|---|
| Number | A single total, optionally compared with an earlier period |
| Line or Area | A trend over time |
| Bar | Comparing categories. Can be stacked or side by side, vertical or horizontal |
| Combo | A line and bars together, usually with one date grouping |
| Donut | Share of a whole, with one grouping that is not a date |
| Treemap or Heatmap | Two groupings at once, such as hour by day of week |
| Table or Pivot | Exact values, especially with several groupings or metrics |
Scatter and Funnel also appear in the picker. Options that do not fit your current metrics and groupings are grayed out. Remove a grouping to see more options, or add one to unlock table-style views.
Increase is good controls the color of comparisons. Leave it on when a higher number is a good thing, like sales. Turn it off for numbers you want to go down, like comps or labor percentage.
Fine-tune the widget
Section titled “Fine-tune the widget”The settings on the right are the same for every widget.
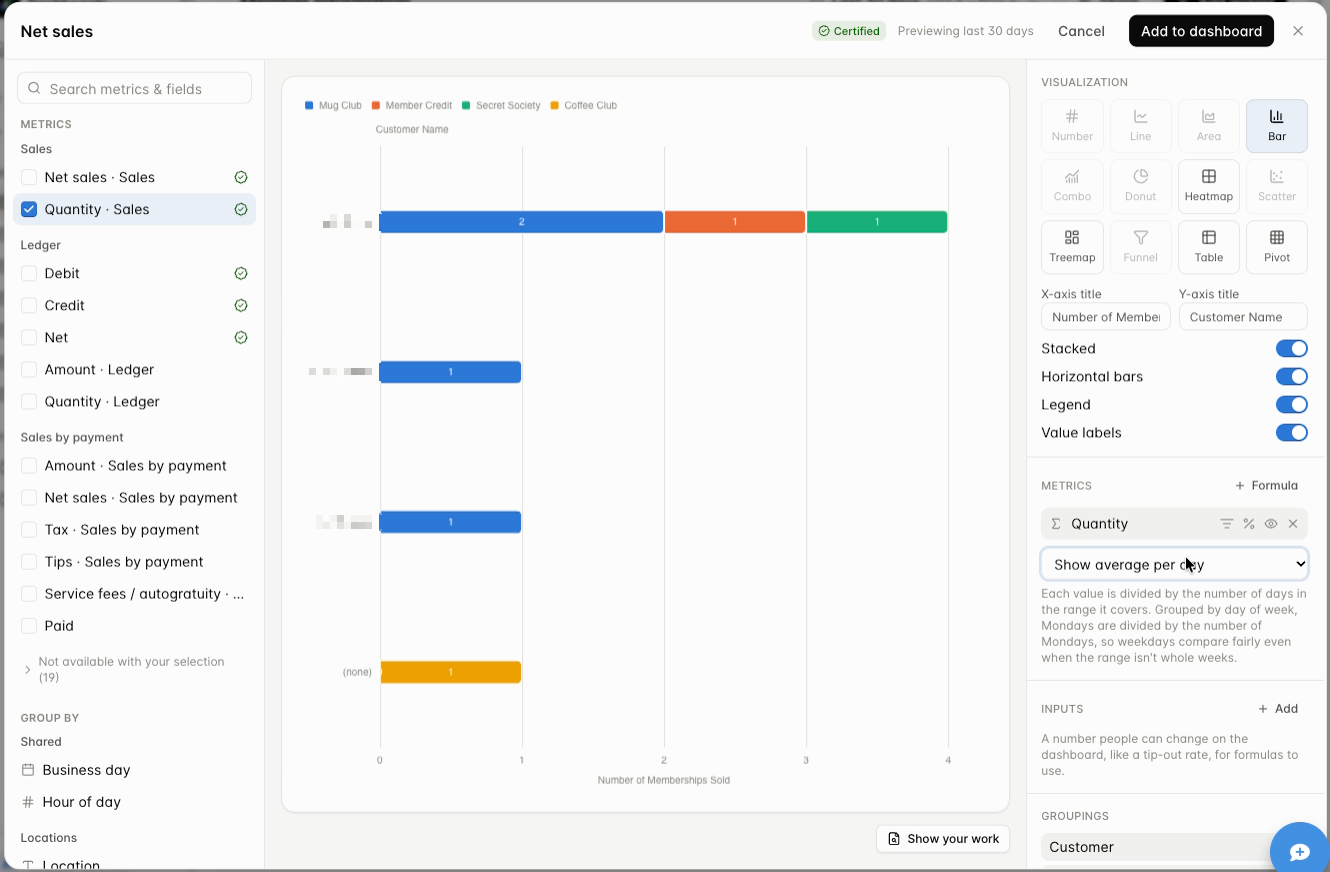
- Chart options: For bar charts you can set the X and Y axis titles and turn Stacked, Horizontal bars, Legend, and Value labels on or off. The chart resizes as your browser window changes size.
- Show metrics as: Choose Show totals, or Show average per day. With average per day, each value is divided by the number of days in the range. When you group by day of week, each weekday is divided by the number of that weekday in the range, so weekdays compare fairly even when your dates do not cover whole weeks. There are also options to work out each day, hour, or 15 minutes first and then add them up.
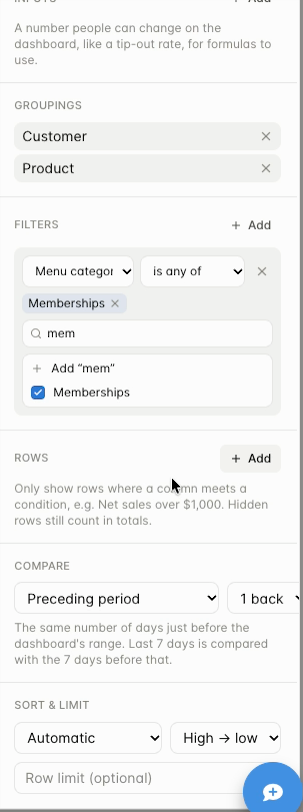
- Filters: Narrow the data that goes into the widget, such as Menu category is any of Memberships. Date range and locations come from the dashboard, so you do not set them here.
- Rows: Hide result rows that do not meet a condition, such as net sales over $1,000. Hidden rows still count in totals, so the visible rows may not add up to the total shown.
- Compare: Show a reference period next to your results, such as the preceding period or the same weekdays last year.
- Sort & limit: Choose how rows are ordered, by any metric or grouping and high to low or low to high. Enter a row limit to show only the top rows.
- Inputs: Add a number that anyone viewing the dashboard can change, such as a tip-out rate. A formula can use it.
- Formula: Calculate a new value from your metrics, such as tips divided by net sales.
- Per-metric controls: Each metric has small buttons for Only where… (apply a condition to just that metric), % of total, and removing it.
Filters and Rows are different
Section titled “Filters and Rows are different”Filters narrow the underlying data before anything is added up. Rows only hides rows after the results are worked out. If the rows you can see do not add up to the total, check whether a Rows condition is hiding some.
Ratios and averages
Section titled “Ratios and averages”A percentage calculated from the totals for the whole period can differ from the average of each day’s percentage. For example, $120 of tips on $1,000 of net sales is 12%, but that is a period-level ratio, not an average of daily ratios. Check how your widget is set to calculate, and compare it with a simple manual calculation for the same dates and locations.
Worked example: customers who bought memberships
Section titled “Worked example: customers who bought memberships”This widget lists each customer who bought a membership in the date range, with the membership they bought.
- Select Add widget and enter the title Customers who purchased memberships.
- In the metrics list, check Quantity · Sales.
- Under Group by, add Customer, Customer email, and Product.
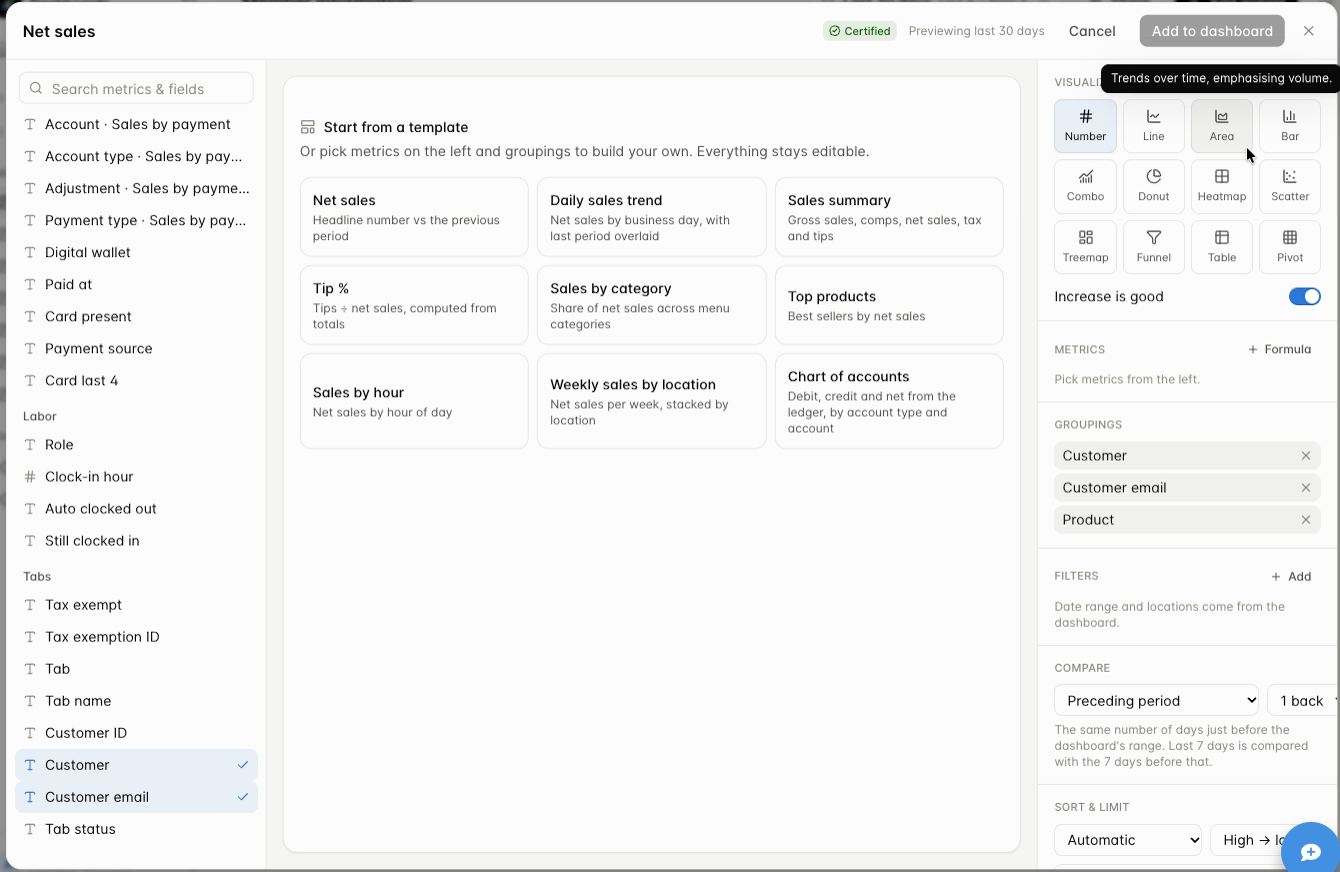
- Under Filters, add Menu category is any of Memberships. Now only membership products are counted.
- Choose a visualization. With three groupings, Table or Pivot work. If you remove Customer email, a bar chart, treemap, or heatmap become available.
- Select Add to dashboard, then check the date range at the top of the dashboard.
Check your work before you save
Section titled “Check your work before you save”Before you add a widget to a dashboard, check these three things:
- Open Show your work (bottom right of the preview) to read the metric definitions, the dates, and the locations the widget used.
- Confirm the dates. The builder shows a preview for the last 30 days (see the note at the top of the builder). Once the widget is saved, it follows the dates selected on the dashboard, so confirm those too.
- Check the badge. A Certified badge at the top of the builder means the widget uses certified metrics. See Check your numbers.
Then select Add to dashboard. To change a saved widget later, open the three-dot menu on the widget and choose Edit. Choose Duplicate first if you want to keep the original.
Build with your AI assistant
Section titled “Build with your AI assistant”If you use an AI assistant such as Claude or ChatGPT, you can connect it to your dashboards and work in plain language. The assistant can look up your metrics, answer a question from your data, and help you build widgets and dashboards.
Connect Claude to your dashboards
Section titled “Connect Claude to your dashboards”- In Claude, open Settings, then Connectors, and choose Add custom connector.
- Enter a name, for example “GoTab Dashboards”, and paste this address:
https://dashboards.gotab.io/mcp - Sign in with your GoTab login when Claude asks. GoTab confirms it is you with a code sent by text message. Approve access when prompted.
- Start a new chat and ask for what you need.
If you use a different assistant, add the same address as a custom connector there. The menu names differ from one assistant to the next.
Some examples to start with:
- “Show net sales by menu category for last month across my locations, highest first.”
- “Build a widget that compares tips by server for the last 7 days.”
- “Which of my dashboards use labor cost?”
What to know before you rely on it
Section titled “What to know before you rely on it”- You see only your own locations. The connection uses your GoTab login, so your assistant can only reach the locations you already have access to.
- Check the answer. An assistant can misread a request. Ask it which metric, dates, and locations it used. For anything you save, open the widget and use Show your work. See Check your numbers.
- Your AI platform decides whether you can add a connector. Each platform sets its own rules for connectors on your account, so check its policies. GoTab Support cannot manage your account with another company.
- Dashboards you build this way are saved in your account. Widgets and dashboards created through the connector appear in Mine, like any you build yourself.
- Getting help. If you have trouble connecting, contact GoTab Support so we can make sure the connector is working. For help using the assistant itself, contact its provider.
- Your results go to your assistant. The answers to your questions are shown in your chat, so follow your company’s policy on sharing business data with AI tools.
What is coming
Section titled “What is coming”We are adding more metrics, groupings, and builder options over time, and some screens may be reorganized to make the builder easier to use. If there is a measure you need and cannot find, contact GoTab Support through the support chat. Ask for the metric to be added to Customer Reporting Dashboards, not the Data Hub dashboard, and describe the report you are building.